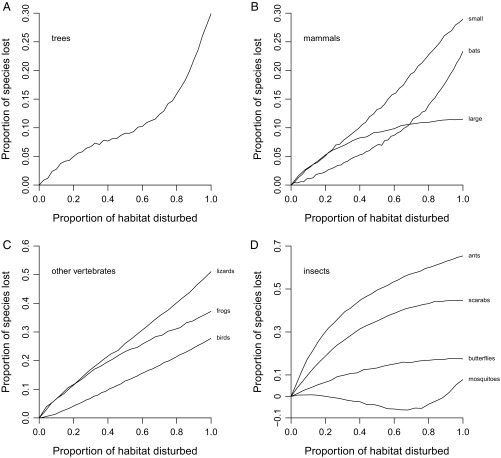
Fig. 3.
Expected species losses given varying amounts of habitat disturbance. The x axis is the proportion of randomly drawn samples that represent disturbed habitats; the y axis is the proportion of species expected to be lost. Underlying estimates are based on the λ5 equation. (A) Trees. (B) Mammals. All large mammal species were sampled by camera traps; terrestrial species of small mammals were sampled using various kinds of traps. (C) Other vertebrates. (D) Insects.

