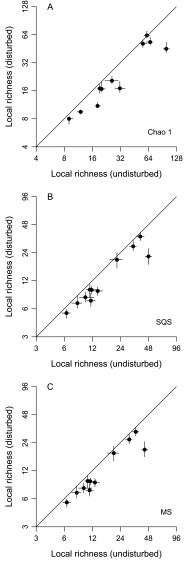
Fig. S3.
Effects of complete habitat disturbance on local richness, as estimated using three additional sampling standardization methods (compare with Fig. 4B). Values for undisturbed- and disturbed-habitat samples are shown on the x and y axes, respectively. Points are ecological groups, and lines through points indicate 95% CIs. Lines of unity are shown. (A) Chao 1. (B) Shareholder quorum subsampling (SQS, a.k.a. coverage-based rarefaction) with a quorum of 0.90. (C) Multiton subsampling with a target of 4.

