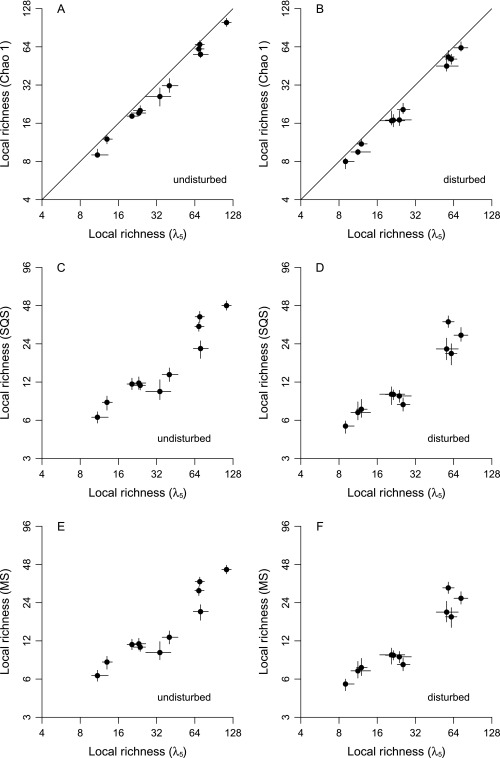
Fig. S5.
Comparisons of local richness estimates generated by the λ5 equation (x axes) and three other methods (y axes, with each method corresponding to a row). Separate estimates for samples from undisturbed habitats (Left) and from disturbed habitats (Right) are given. Points are ecological groups, and lines through points indicate 95% CIs. Lines of unity are shown only for Chao 1 because the other methods work through interpolation instead of extrapolation, so average values are not comparable to λ5 values. Shareholder quorum subsampling quorums are 0.90, and multiton targets are 4. (A) Chao 1 (undisturbed data). (B) Chao 1 (disturbed data). (C) Shareholder quorum subsampling (undisturbed data). (D) Shareholder quorum subsampling (disturbed data). (E) Multiton subsampling (undisturbed data). (F) Multiton subsampling (disturbed data).

