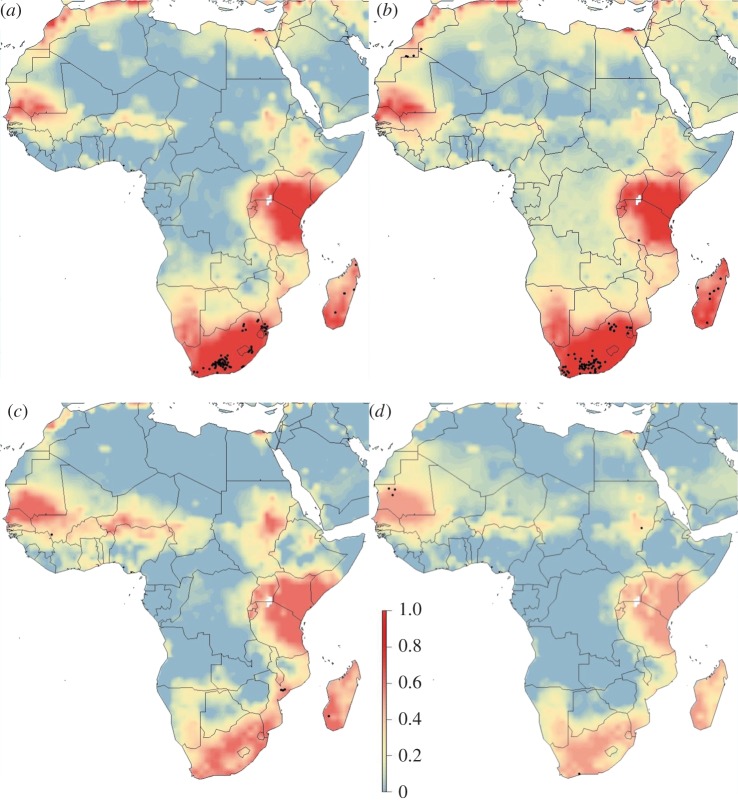
Figure 3.
Spatial distribution of RVF risk for years with a strong La Niña event for (a) quarter 1, January–March; (b) quarter 2, April–June; (c) quarter 3, July–September; and (d) quarter 4, October–December. Risk was estimated from occurrence records from 2004 to 2016 with a Bayesian additive regression model using INLA. Risk probability per 1° grid cell is represented on a linear colour scale from 1 to 0, where red is most suitable given the environmental conditions and dark blue unsuitable. Axis labels indicate degrees, in a World Geodetic System 84 projection. Filled black circles represent locations of historic RVF outbreaks (see electronic supplementary material, table S1).

