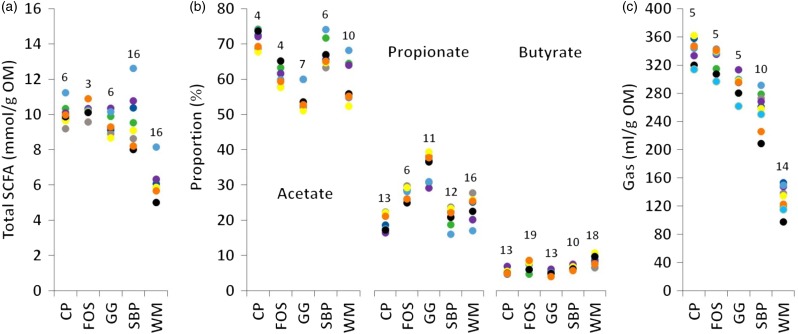
Fig. 1.
Inter-individual variation in in vitro total SCFA production (a), proportions of acetate, propionate and butyrate (b) and gas production (c). Coloured markers represent results from individual cats used as faecal donors (n 8 for SCFA and n 9 for gas production). CV (%) per substrate is indicated above the markers. OM, organic matter; CP, citrus pectin; FOS, fructo-oligosaccharide; GG, guar gum; SBP, molassed sugar beet pulp; WM, wheat middlings.

