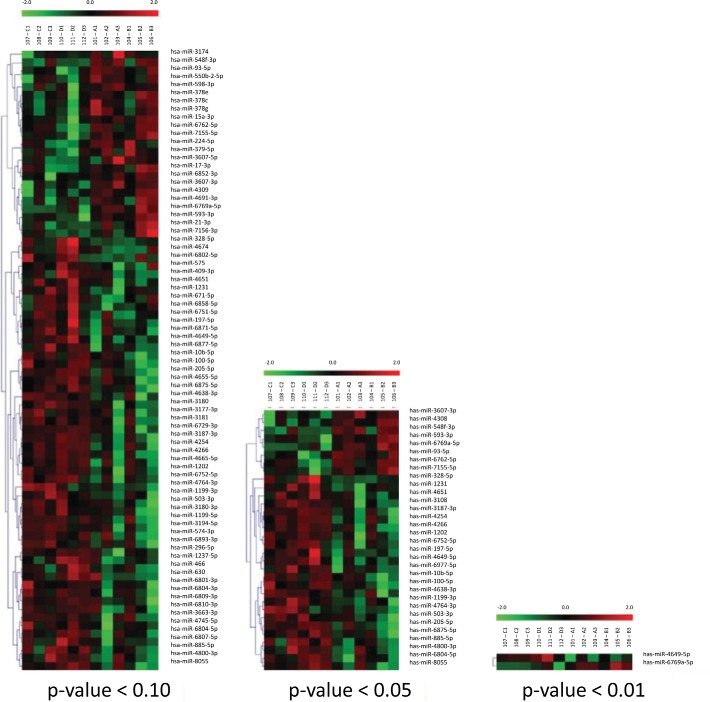
Figure 1.
Heat map of differentially expressed microRNAs (miRNA) by hives status. Only those miRNAs whose level of expression differed at a given p value are shown. The first six columns represent patients who were negative for hives; the last six columns represent patients with active hives. Different miRNAs are clustered according to the degree of similarity in the level of expression. Red represents miRNAs with up to two-fold or greater increased expression; green represents miRNAs with up to two-fold or greater decreased expression; and different levels of shading (from red to black, or green to black, with black indicating no difference) indicate values between these extremes. The average for all 12 patients is taken as the reference value. Each colored column is labeled with the sample number as well as the group and patient identity corresponding to Table 1.

