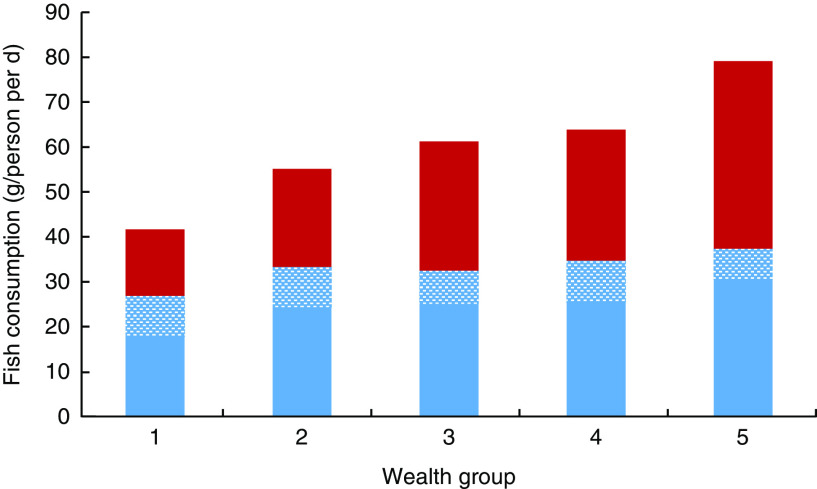
Fig. 2.
(colour online) Mean consumption (g/person per d) of non-farmed ( , non-farmed fresh fish;
  , non-farmed dried fish*) and farmed fish (
 ) by wealth group† in rural Bangladesh (adjusted for age, sex and geographic region), October 2011–March 2012. *Dried fish includes fermented and dried fish, adjusted to fresh weight equivalent. The sum of non-farmed fresh fish and non-farmed dried fish equals total non-farmed fish consumption. †Wealth group 1 represents the poorest 20 % of households and wealth group 5 represents the wealthiest 20 % of households

