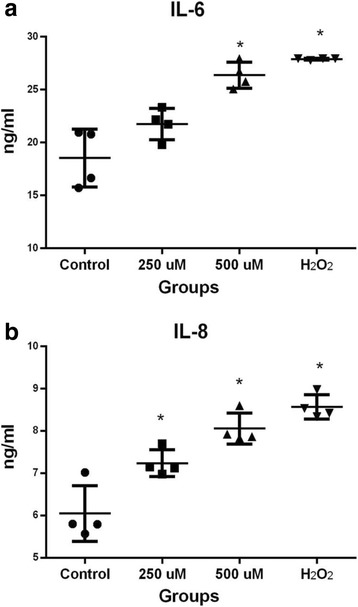
Fig. 4.

Quantification of cytokines: IL-6 and chemokine IL-8 in HC exposed to FFA. a IL-6. b IL-8 in HC treated with 250 and 500 μM of FFA, and H2O2 (100 μM) was used as positive control for 48 h. Each bar represents the mean value ± standard deviation of at least three independent experiments for each four different patients. * P < 0.05 with respect to untreated HC
