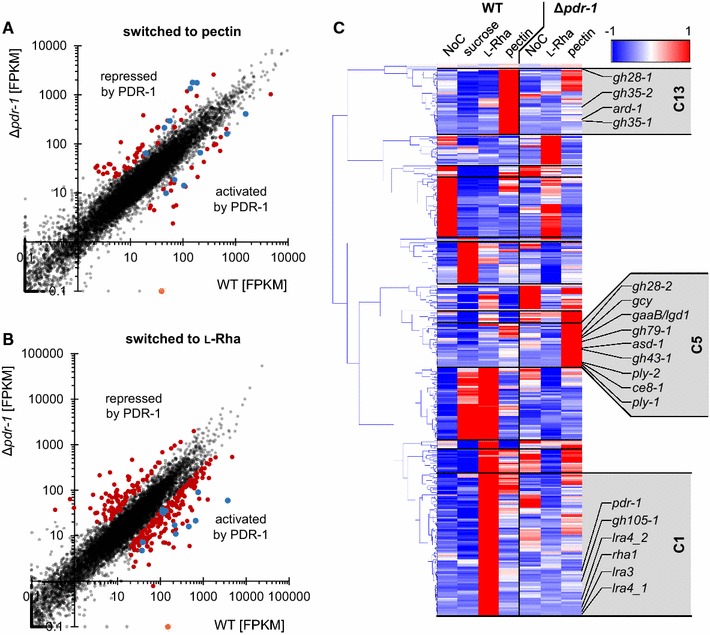
Fig. 3.

Scatterplots and clustering of RNA-seq data from WT and Δpdr-1. Scatterplot diagram (A, B) axes are log10-scaled. A Full-genome expression profile of WT induced for 4 h on 1% pectin was plotted against the transcriptional response of the Δpdr-1 mutant induced on the same medium (black dots). Genes of Δpdr-1 that were threefold up- or downregulated to WT are marked with red dots. Genes that code for pectin degrading enzymes (according to Table 1) are represented by blue colored dots. The position of pdr-1 is denoted with an orange dot. B Same as in A, but 2 mM l-Rha was used for induction. C 367 genes were either repressed or activated by PDR-1 and this subset was analyzed by hierarchical clustering. RNA-seq data of WT or Δpdr-1 after 4 h on either 2 mM l-Rha, 1% pectin, 2% sucrose (only WT), or no carbon source (NoC) were used. The position of pectinases and l-Rha/d-GalA catabolism genes are indicated next to their respective clusters (C1, C5, or C13). lra4_1 = NCU05037, lra4_2 = NCU03086
