Fig. 5.

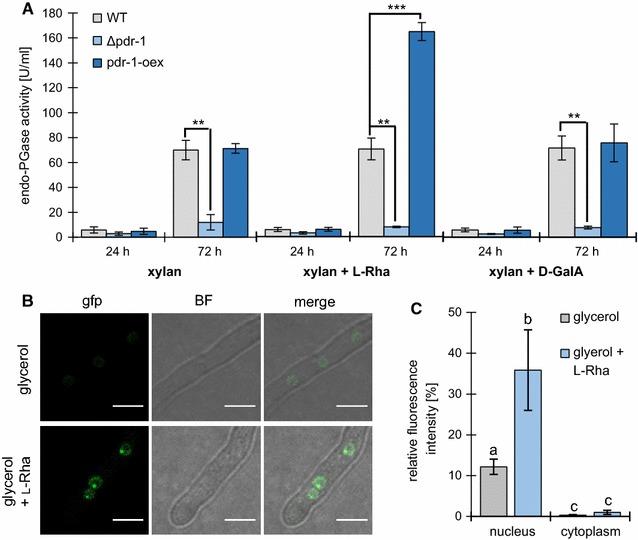
Endo-PGase activity of pdr-1-oex and subcellular localization of pdr-1-gfp in the presence of inducer molecules. A Strains were grown on 1% xylan plus 0.5 mM l-Rha or d-GalA or 1% xylan without any additives for 3 days. Endo-PGase activity was determined from culture supernatants taken after 24 or 72 h, respectively. Error bars represent standard deviation (n = 3). Significance was determined by an independent two-sample t-test of WT against all other strains with **p < 0.01 and ***p < 0.001. B The pdr-1-gfp strain was grown for 3 h on either 2% glycerol plus 2 mM l-Rha or 2% glycerol without any additives and fluorescence (gfp) as well as brightfield (BF) images were taken to determine the subcellular localization of PDR-1-GFP. Scale bars equals 5 µm. C Fluorescence intensity was measured for both culture conditions described in B. Error bars represent standard deviation (glycerol: n = 65; glycerol + l-Rha: n = 74). Significance was determined by analysis of variance (ANOVA) followed by a post hoc Tukey’s test. The letters above each bar indicate statistical significance; bars sharing the same letter show no significant difference, while different letters represent a significant mean difference of p < 0.001
