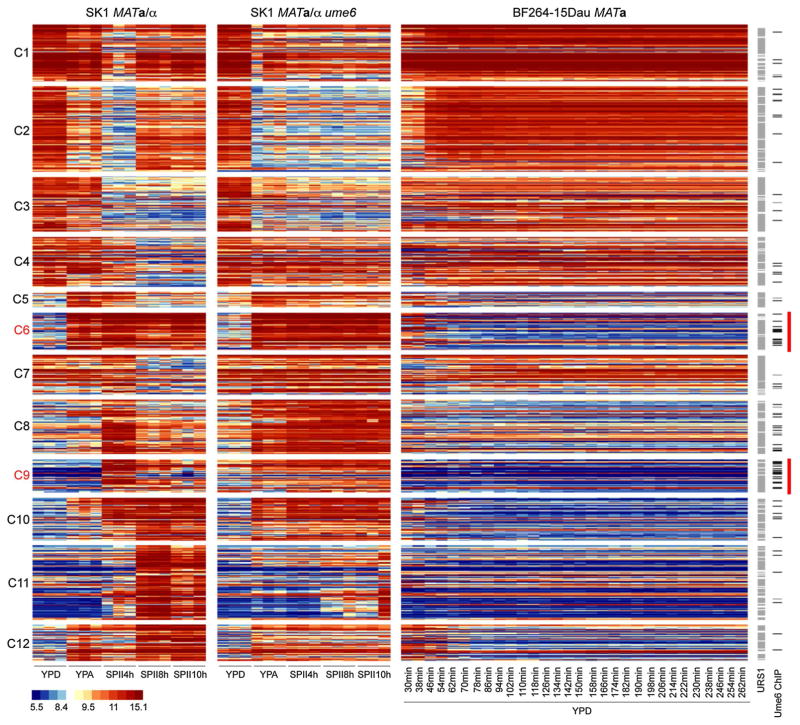
Fig. 2.
RNA profiles of diploid wild-type and ume6 strains in growth media and sporulation medium versus haploid cells in YPD growth medium. A false-color heatmap is shown for GeneChip expression signals. Every line corresponds to a probeset (transcript) and every column to a sample replicate. Strains are indicated at the top; growth media (YPD, YPA) and time points in sporulation medium (SPII 4, 8 and 10 h) are shown at the bottom. Cluster numbers are given to the left. Predicted Ume6 target motifs (URS1) and in vivo target promoters (Ume6 ChIP) are shown to the right. A color scale for log2-transformed data is given. Red bars mark increased occurrence of Ume6 binding in clusters C6 and C9

