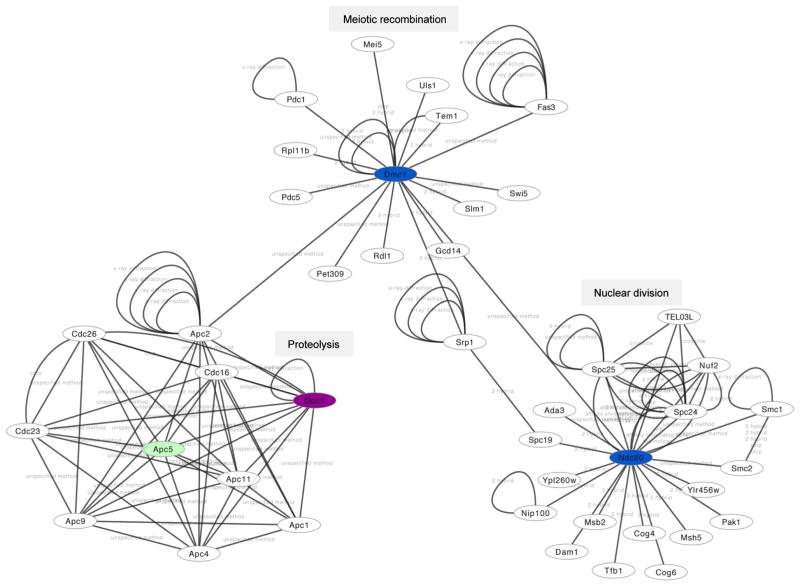
Fig. 6.
Protein network interactions. A protein network view created with Cytoscape 3.2.0. is shown. Ume6 target proteins that are repressed in mitosis and that fall into cluster 8 and 9 are shown in magenta and blue, respectively. Apc5, shown in green, is among indirect targets. The network annotation data provided by BIND (see “Materials and methods”) were manually edited for clarity. We note that some complexes refer to publications that report the interaction but do not provide information about the experimental approach used to detect it. Such cases are termed unspecified (interaction detection) method

