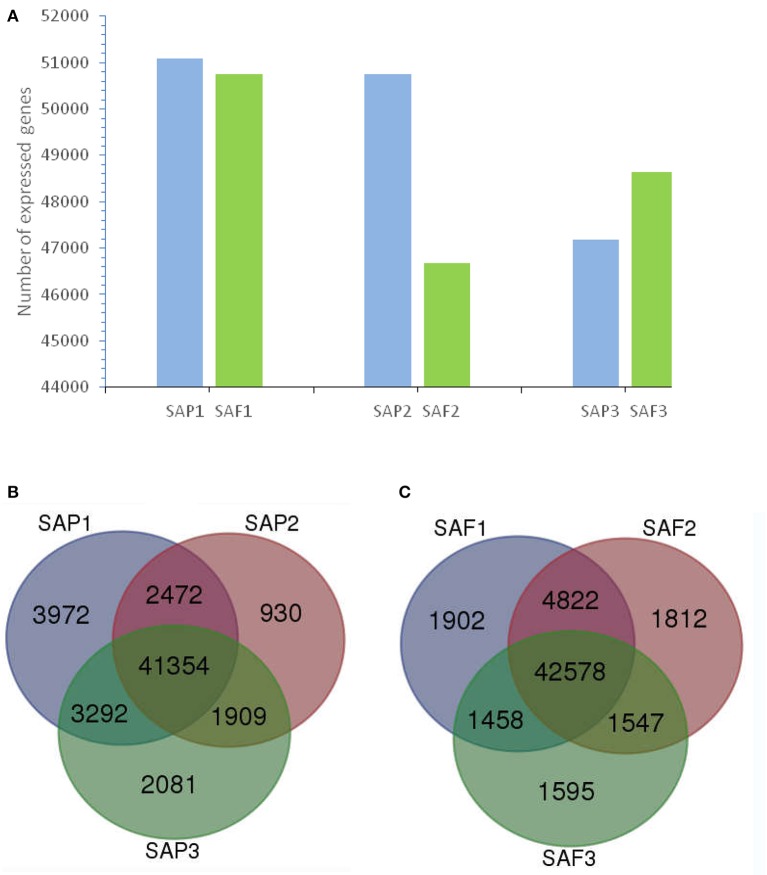
Figure 3.
Transcriptome analysis of stem apex of primocanes and floricanes in Rubus. (A) Transcriptome sizes of stem apex of primocanes and floricanes at three developmental stages. (B,C) Venn diagram showing the overlaps between three stages of SAP and SAF. The number in parentheses after each stage designation is the total transcripts detected in that stage(s).

