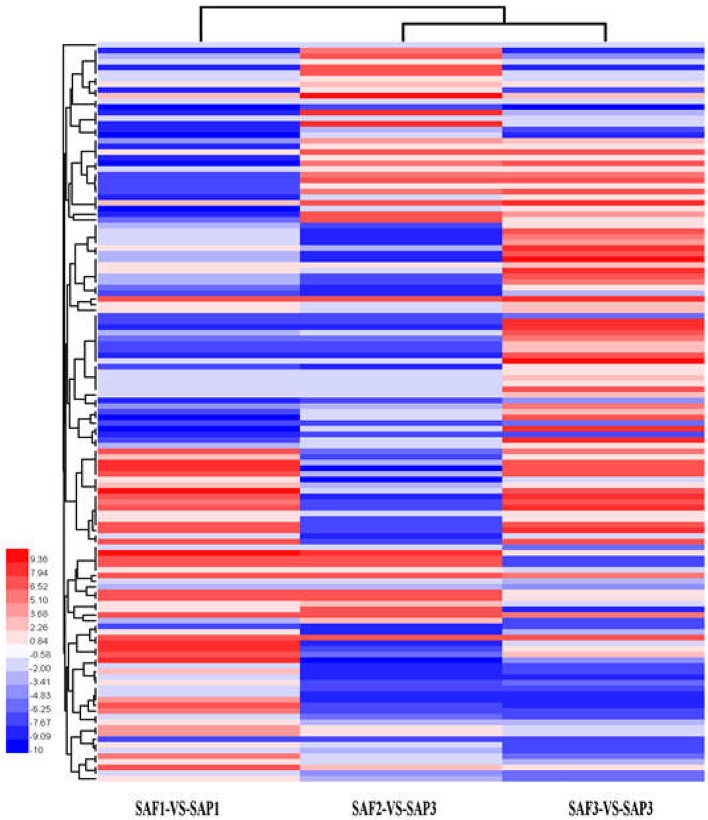
Figure 5.
Hierarchical clustering (HCE) analysis of differentially expressed transcripts between stem apex of primocane and floricane at three developmental stages (SAP1-VS-SAF1, SAP2-VS-SAF2, and SAP3-VS-SAF3, “a” was the control and “b” was experimental group in “a-VS-b”). The clusters from A to H indicate the eight major clusters resulting from HCE analysis. Each line refers to data from one gene. The color bar represents the log10RPKM and ranges from blue (low expression) to red (high expression).

