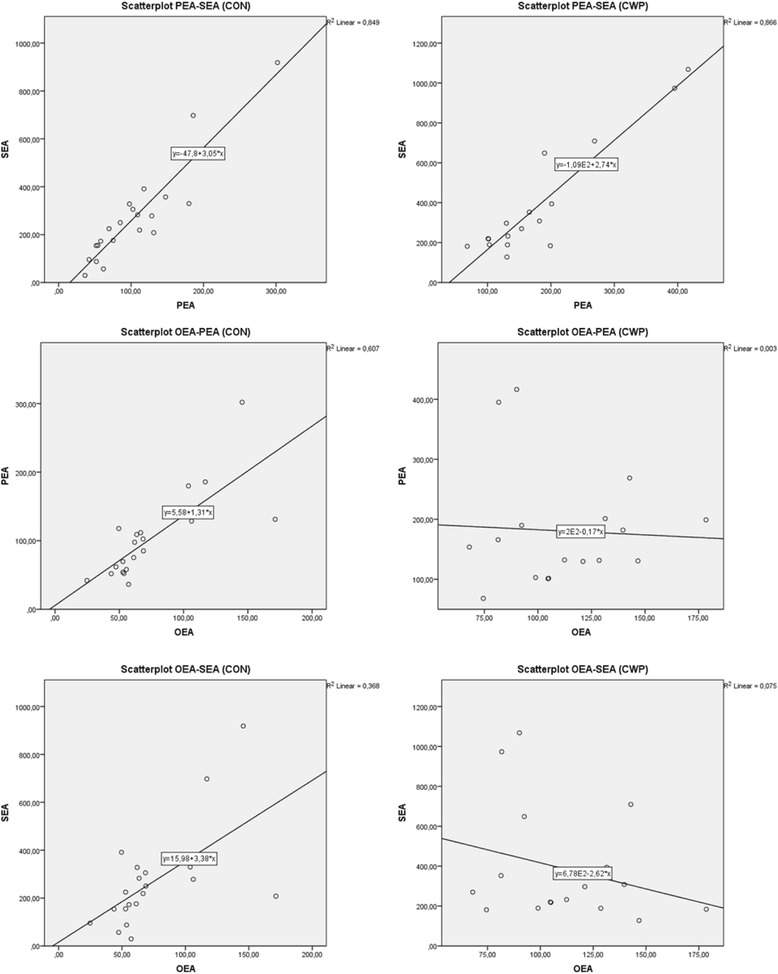
Fig. 2.

Bivariate correlation for the three N-acyletanolamines in the two groups illustrated with scatterplots. Best fitted regression (R2) lines describe the direction of the correlation. In the CON (panel to the left), the directions are consistently positive. In the CWP (panel to the right), the direction is positive for PEA vs. SEA but weakly negative for OEA vs. PEA and OEA vs. SEA
