Fig. 2.

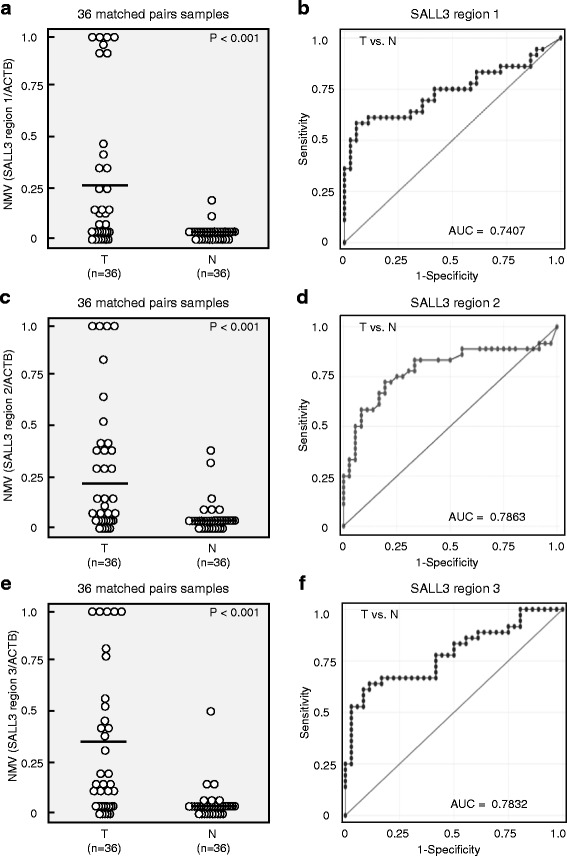
Pattern of methylation in matched pairs of head and neck tumors and adjacent normal mucosal tissues, and ROC curve analysis of NMV. a SALL3-P1 NMVs of head and neck tumors were higher than those of adjacent normal mucosal tissues (P < 0.001). b Area under the ROC curve (AUROC) for SALL3-P1 was 0.7407. c A higher frequency and degree of SALL3-P2 methylation was observed in head and neck tumors than in matched normal mucosae (P < 0.001). d AUROC value for SALL3-P2 was 0.7863. At the cutoff value of 0.11, sensitivity was 58.3% and specificity was 91.7%. e SALL3-P3 NMVs of head and neck tumors were higher than those of paired adjacent normal mucosae (P < 0.001) f AUROC value for SALL3-P3 was 0.7832
