Fig. 1.

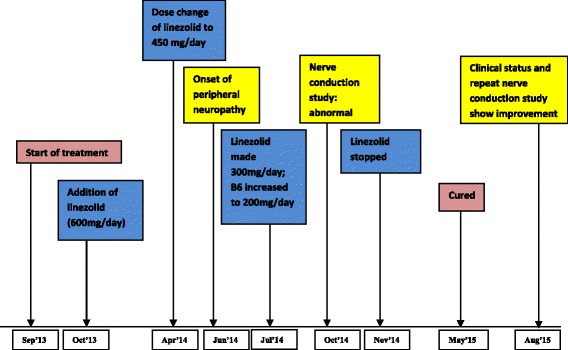
Timeline of events. The figure represents the timeline of events in the described patient starting with beginning of treatment, occurrence of neuropathy, intervention and subsequent improvement in follow up

Timeline of events. The figure represents the timeline of events in the described patient starting with beginning of treatment, occurrence of neuropathy, intervention and subsequent improvement in follow up