
Figure 3.
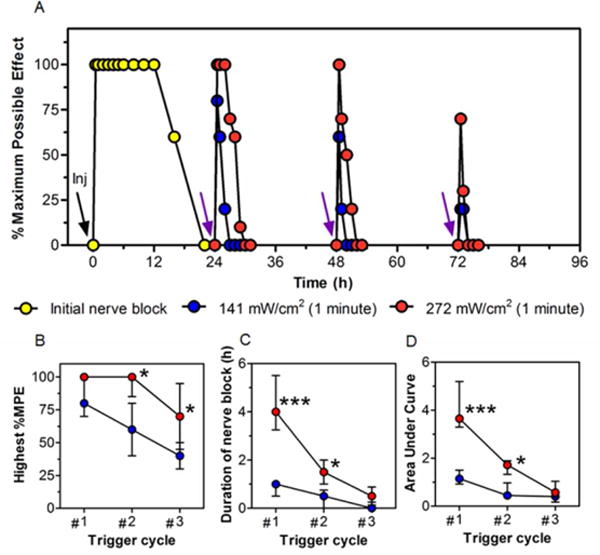
Phototriggered local anesthesia in the rat footpad. (A) Effect on local anesthesia of injection (black arrow labeled “Inj”) of 100 μL of LTSL-GNR-TTX + Lip-DMED and subsequent irradiation (purple arrows, 808 nm continuous wave NIR laser at 141 or 272 mW/cm2, for 1 minute). Local anesthesia is presented as % maximum possible effect; see Methods. Data are medians; Interquartile ranges are in Table S2 (n = 4 per group; for the initial local anesthesia, n = 8 for the 2 groups). (B) The highest %MPE and (C) the duration of local anesthesia after each triggering at different laser irradiances. (D) The AUC of the %MPE-time curves in panel A (see Methods). Data are medians with 25th and 75th percentiles in (B-D). Asterisks are from comparison of 272 mW/cm2 and 141 mW/cm2 *p < 0.05 and ***p < 0.001.