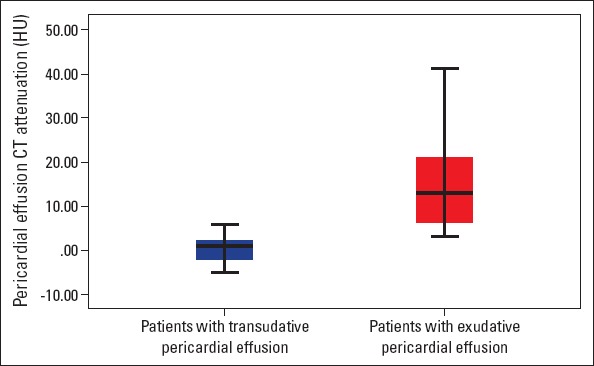
Figure 3.

Box plots showing the attenuation values for the transudate and exudate groups. The boxes stretch from the 25th to 75th percentile. The horizontal line across each box is the mean. The vertical lines with whiskers extending below and above the boxes indicate the minimum and maximum values, respectively
HU - hounsfield unit.
