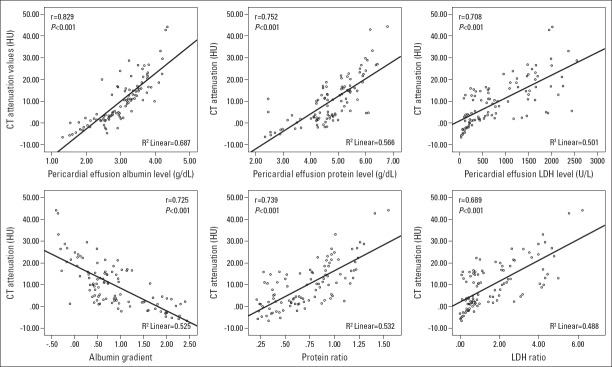
Figure 5.
Correlation between CT attenuation values and pericardial fluid albumin level, protein level, LDH–albumin gradient, protein ratio, and LDH ratio. Each dot represents one patient; the straight line represents the best fit line obtained by linear regression analysis
CT - computed tomography; HU - hounsfield unit; LDH - lactate dehydrogenase.

