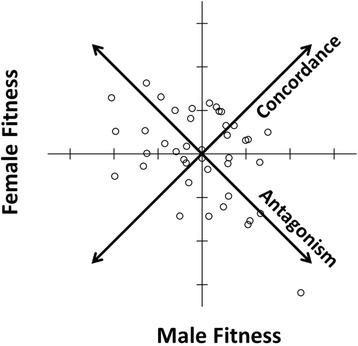
Fig. 1.

Intersexual genetic correlation for fitness among the 41 isofemale lines used here, demonstrating abundant SA genetic variance (see [25]), as well as adequate representation throughout the distribution of all four variables. Derived axes/variables, antagonism and concordance (see Methods), represent continuums ranging from extreme female-benefit/male-detriment isofemale lines (quadrant 2) to extreme male-benefit/female-detriment isofemale lines (quadrant 4), and from generally low-fitness (i.e. low-male/low-female) isofemale lines (quadrant 3) to generally high-fitness (i.e. high-male/high-female) isofemale lines (quadrant 1), respectively.
