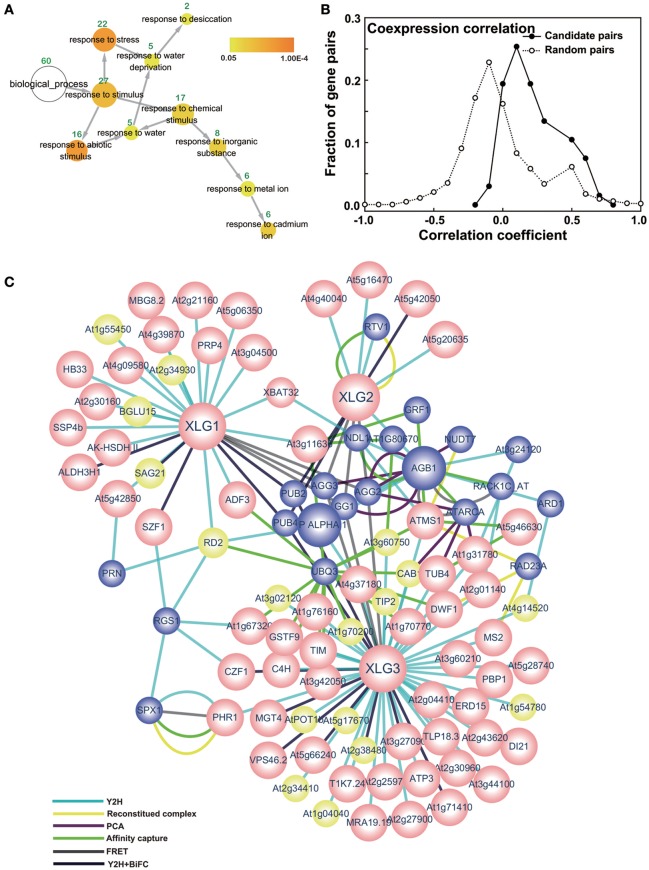
Figure 1.
Core XLG interactome. (A) GO enrichment of the interactors. The GO analysis was performed in cytoscape using all the interactors from the Y2H screen. The yellow nodes are significantly represented (p < 0.05) and the white node represents the entire set. The color bar indicates the correction p-value for each categories, which was done by Benjamini & Hochberg False Discovery Rate (FDR) correction. The area of a node is proportional to the number of genes (green numbers labeled above the nodes) in the test set annotated to the corresponding GO category. Arrows indicate the hierarchy of the categories. (B) Co-expression coefficient distribution of candidate and random pairs. The co-expression coefficient between the 67 pairs of baits and prey were calculated using the online software CressExpress (http://cressexpress.org/). The solid line indicates candidate protein pairs discovered here and the dotted line indicates random protein pairs. Student t-test was performed in SAS8.0 and the p = 2E-4. (C) Core XLG interactome network. The 72 interactors from the Y2H screen plus additional candidates that have at least 2 edges are shown. The nodes with pink and yellow color indicate interactors identified here and blue nodes are taken from the BioGRID database and the literature (Wang et al., 2017). Pink nodes designate an interactor that has a positive co-expression coefficient, and yellow nodes have a negative co-efficient. Different edge colors represent the different interaction methods as indicated.

