Figure 4.
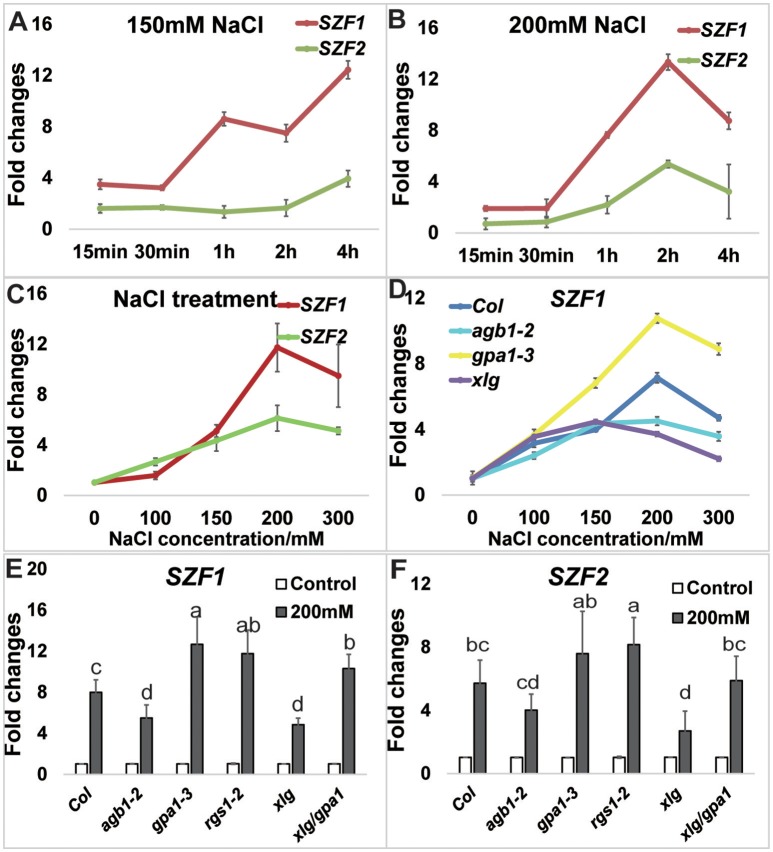
NaCl-induced expression of SZFs. Seven-day-old Arabidopsis seedlings grown hydroponically in dim light room were used for the treatment. (A) The expression level of SZF1 and SZF2 in the time course of 0, 15, 30 min, 1, 2, and 4 h in the 150 mM treatment as described in the Materials and Methods. (B) The expression level of SZF1 and SZF2 in the time course of 0 min–4 h after the 200 mM treatment. (C) The expression level of SZF1 and SZF2 in the NaCl dose responses of 0, 100, 150, 200 mM. (D) The expression level of SZF1 and SZF2 in the NaCl dose responses of 0, 100, 150, 200 mM in the mutants of Col, agb1-2, gpa1-3, xlg1/2/3. (E,F) The expression level of SZF1 (E) and SZF2 (F) in response to 200 mM NaCl for 2 h between Col and G protein mutants [agb1-2, gpa1-3, rgs1-2, xlg1/xlg2/xlg3 triple (indicated xlg) and xlg1/xlg2/xlg3/gpa1-3 quadruple (indicated xlg/gpa1)]. ANOVA analysis was performed using SAS8.0 set at a p = 0.05 with five biological replicates.

