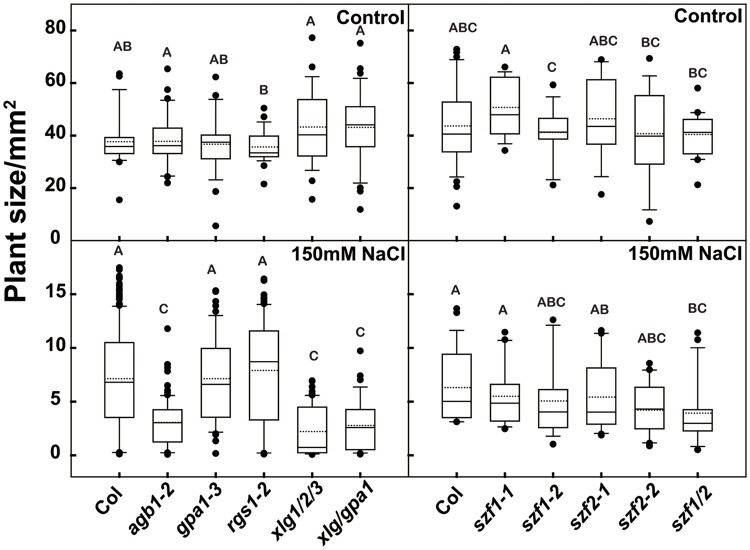
Figure 5.
Salt phenotypes of the G protein and szf mutants. Arabidopsis seedlings were grown horizontally on ¼ MS medium with 1% sucrose with or without 150 mM NaCl under continuous dim light for 2 weeks, and the leaf area were measured to evaluate the growth status of the plants. The box plot indicates the distribution leaf area. The solid line in the box indicated the median and the dot line indicated the mean value. The bottom and the top of the box represented first and the third quartiles. The start and the end of the whiskers represented the maximum and minimum of the value. The dots represented the outliers. Different lowercases letter indicate significant differences (p < 0.05) between any two genotypes. The ANOVA analysis was performed using SAS8.0, n ≥ 24.

