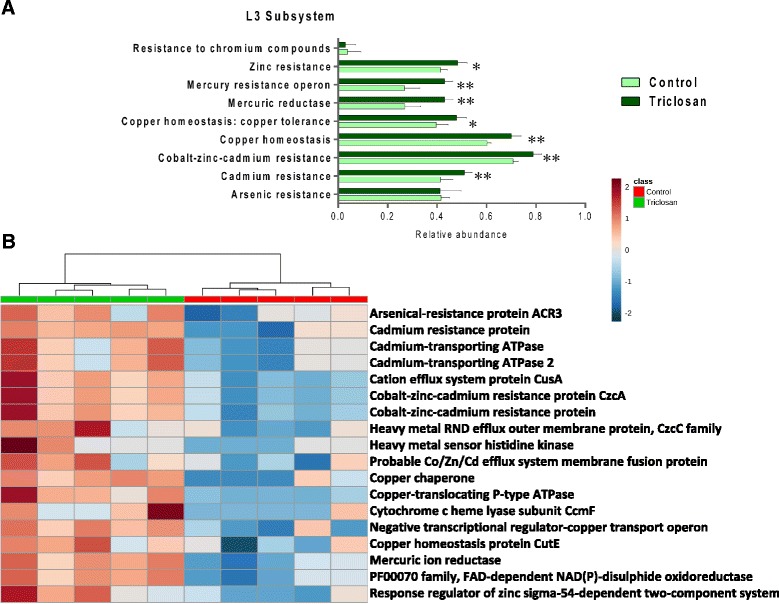
Fig. 6.

(a) Comparative metagenomic analysis in terms of metal resistance at the Level 3 subsystem. (* p < 0.05; ** P < 0.01) (b) Heat map constructed using relative abundances of metal resistance-related bacterial genes that are significantly different between the triclosan and control group. (p < 0.05)
