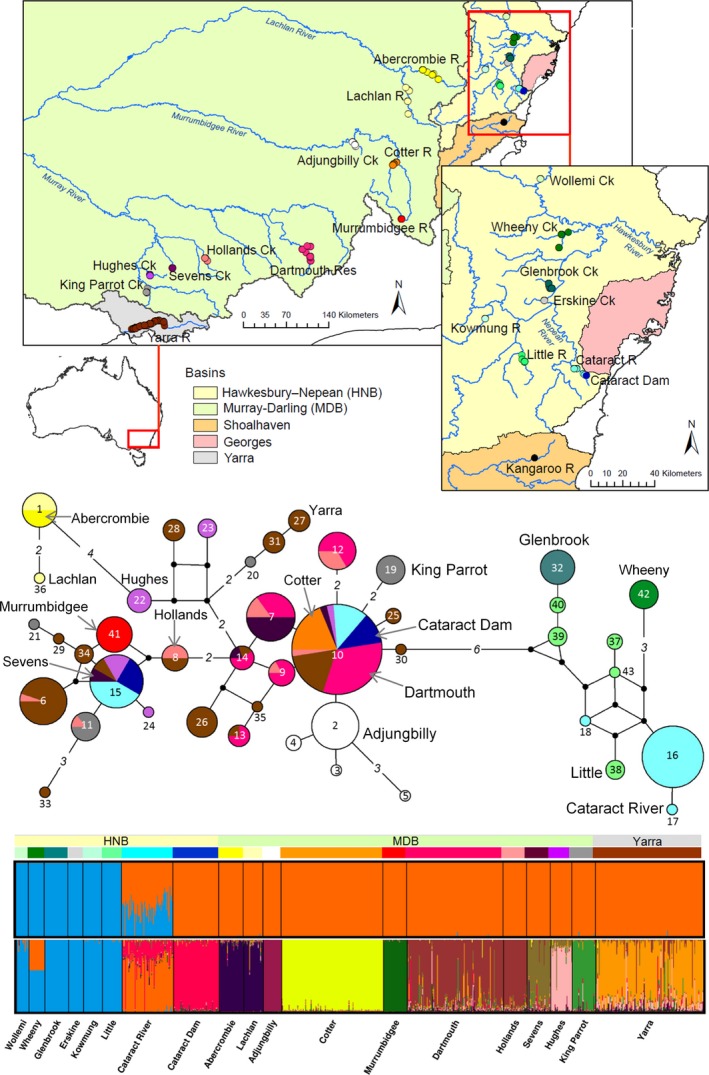
Figure 1.

Geographic distribution of Macquarie perch samples analysed for this study (top), mitochondrial control region haplotype network showing distribution of haplotypes across populations (middle; Shoalhaven haplotype not included) and individual memberships in two or 12 genetic clusters inferred from microsatellite data (major structure inferred by K = 2 and K = 12 structure analysis of all HNB and MDB samples; see Appendix S9; Shoalhaven individual not included). Two colour stripes above structure plots are colour codes for basins (top) and populations (bottom), as on map. Yarra and Cataract Dam populations are translocated from the MDB; Cataract River comprises hybrids between endemic HNB lineage and fish dispersed from Cataract Dam (details in Appendix S9). On the haplotype network, populations are coloured as on the map (population labels are also given for each colour); each circle is a unique haplotype (number within‐haplotype ID, small black circle – missing haplotype); the size of each circle is proportional to the haplotype frequency; connections between circles are single substitutions unless marked with a number (of substitutions). In five locations, a single haplotype is fixed (1 in Abercrombie, 10 in Cotter, 41 in Murrumbidgee, 32 in Glenbrook, 42 in Wheeny)
