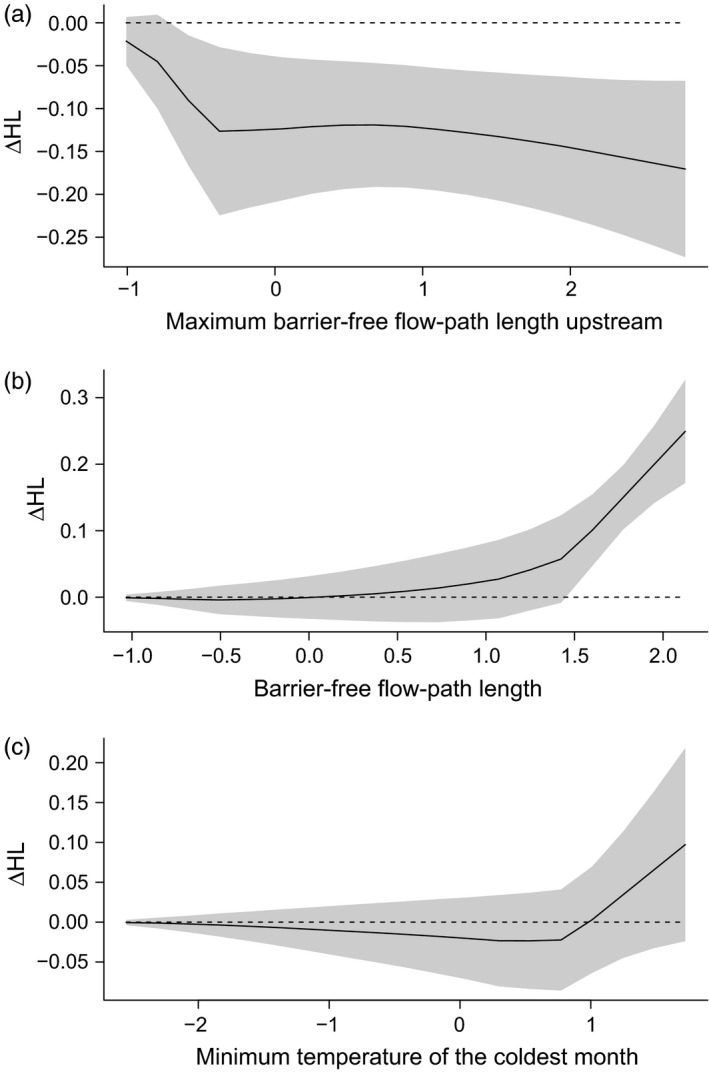
Figure 3.

Fitted relationships between HL and environmental variables for variables with probability of inclusion greater than 0.7. The x‐axis shows standardized values for each variable (e.g. a value of 1 means 1 standard deviation above the mean value for that variable), and the y‐axis shows deviation from the mean HL value (in units of HL) for a given standardized value of the predictor variable. Grey shading is one standard deviation of the fitted effect. Models included basin and site as clustering variables, so these fitted effects account for differences among sites or between basins
