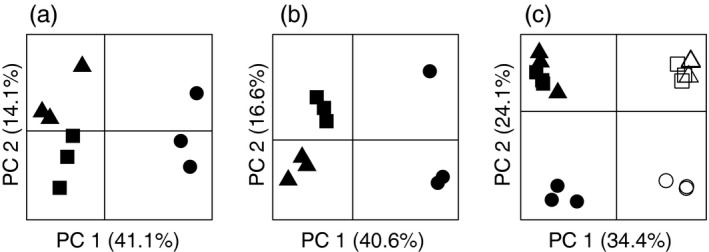
Figure 2.

Principle component bi‐plots of the first two principle components derived from gene transcription count data between samples for all genes for round goby (a), tubenose goby (b), and putative orthologous genes for both species combined (c) from three acute temperature treatments: control—18°C (squares), cold treatment—5°C (circles), and warm treatment—25°C (triangles). Round goby are represented by the solid symbols and tubenose goby by the open symbols in panel c
