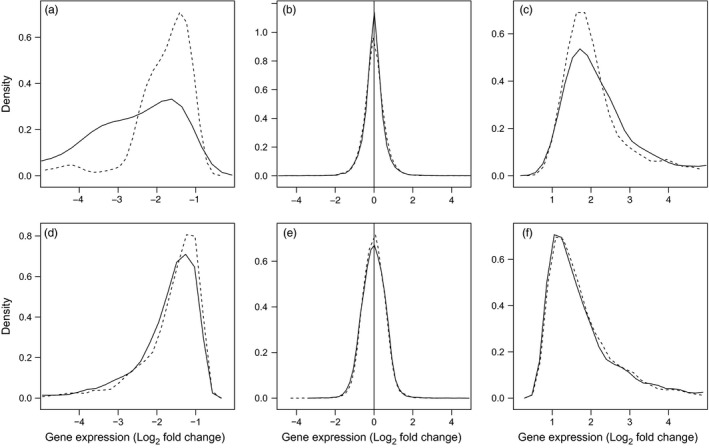
Figure 3.

Differences between round and tubenose goby in the distribution of Log2 fold changes of gene transcription in response to increased temperature challenge (a–c) and decreased temperature challenge (d–f). Lines represent the relative density (amount) of genes corresponding to the fold change indicated on the x‐axis for round goby (solid lines) and tubenose goby (dashed lines). Panels present genes with statistically significant downregulation of transcription (a, d), no transcriptional plasticity (b, e), and statistically significant upregulation of transcription (c, f) as determined for each species using negative binomial generalized linear models (FDR < 0.05, see Section 2). The generally higher density of genes for tubenose goby at lower magnitude fold changes indicates reduced scope for transcriptional plasticity. The shift of the distribution between species is statistically significant for comparisons a, c, and d based on Wilcoxon rank‐sum tests (Table 1)
