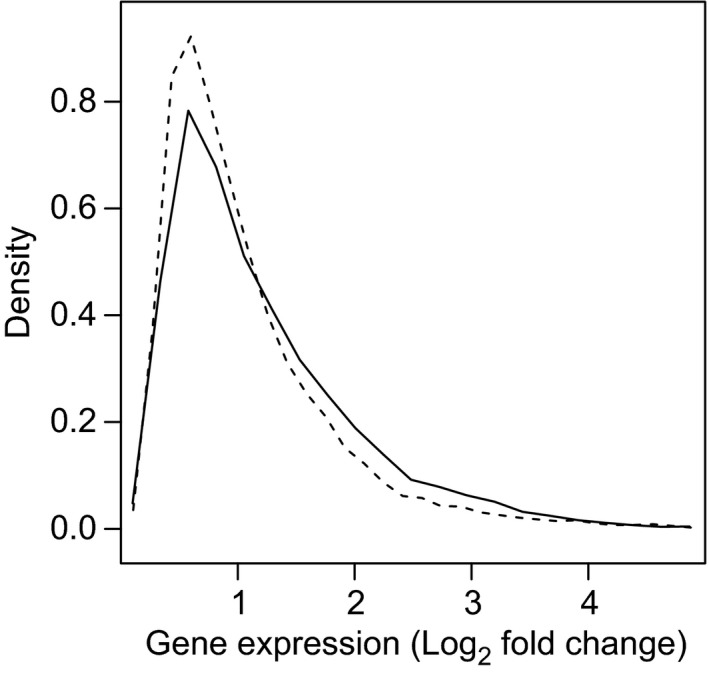
Figure 5.

Distribution of Log2 fold changes of transcription for putative orthologous genes differentially transcribed (FDR < 0.05) between round and tubenose goby. Lines represent the relative density (amount) of genes corresponding to the magnitude of fold change indicated on the x‐axis for orthologous genes one species over‐transcribes relative to the other. Genes transcribed higher in round goby are represented by the solid lines and genes transcribed higher in tubenose goby are represented by the dashed lines. Tubenose goby over‐transcribes genes to a greater magnitude than round goby based on a Wilcoxon rank‐sum test (p < .0001)
