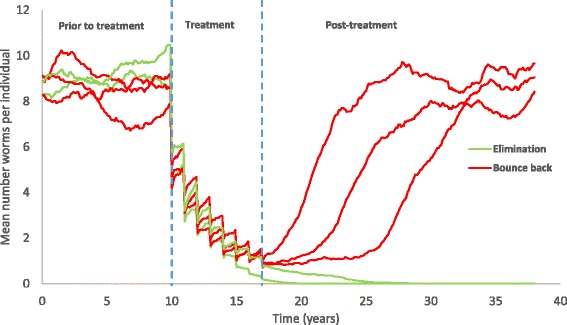
Fig. 2.

An illustration of five simulation repeats, showing stochastic variability and the impact of treatment. X-axis: year of simulation. Y-axis: the mean number of parasites in each independent population. In two repeats, elimination is successful, in three others the parasite population bounces back
