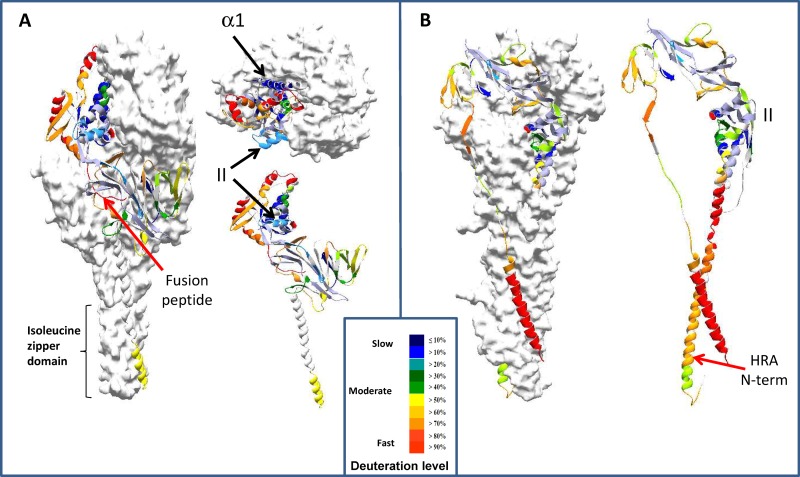
FIG 7.
HDX-MS data transposed on the structural models of Pre-F-GCN4t and Post-F-XC. Two of the Pre-F-GCN4t monomers are shown in a surface representation, while the third is shown in a ribbon representation. Results from the 15-s deuteration time point are shown. Deuteration levels are presented in the key. Red arrows indicate the positions of two peptides lacking correlation between surface accessibility and deuterium incorporation. (A) Exchange kinetics of peptides from Pre-F-GCN4t in longitudinal sections (left and bottom right) and from above (top right); (B) exchange kinetics of peptides from Post-F-XC as seen in longitudinal sections. The positions of α-helix α1 and the palivizumab binding site (site II) are shown by black arrows.

