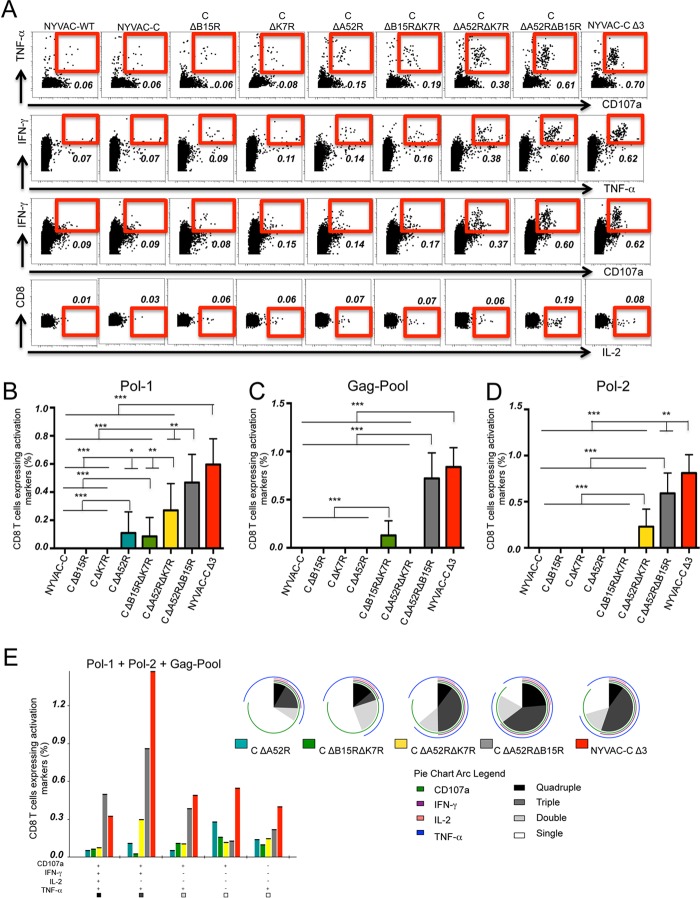
FIG 6.
Deletion of the A52R, B15R, and K7R genes influences adaptive HIV-specific CD8 T cell immune responses. Shown are the vaccine-induced HIV-specific CD8 T cell response in mice (n = 4/group) immunized following a heterologous DNA prime/virus boost regimen (107 PFU of NYVAC-C or NYVAC-C deletion mutants). (A) Percentages of TNF-α+ CD107a+, IFN-γ+ TNF-α+, IFN-γ+ CD107a+ double-positive and IL-2 single-positive T cells. The total value (magnitude) is the sum of percentages of CD8 T cells that express IFN-γ and/or TNF-α and/or IL-2 and/or CD107a, measured by intracellular cytokine staining (ICS). Nonspecific responses of mice infected with control NYVAC-WT were subtracted from the total magnitude. (B to D) Magnitude of Pol-1 (B)-, Gag-Pool (C)-, or Pol-2 (D)-specific CD8 T cell responses. Graphs show the mean ± confidence interval (CI). (E) Functional profile of adaptive Gag-Pol-specific CD8 T cells. Combinations of responses (x axis) and percentages of functionally distinct cell subsets (y axis) are shown in the bar graph. Responses are grouped and color coded based on the number of functions. Pie chart colors indicate the percentage of cytokine-producing cells based on the number of functions (inside) and the different activation markers (outside). Data are representative of two independent experiments. *, P < 0.05; **, P < 0.01; ***, P < 0.001.

