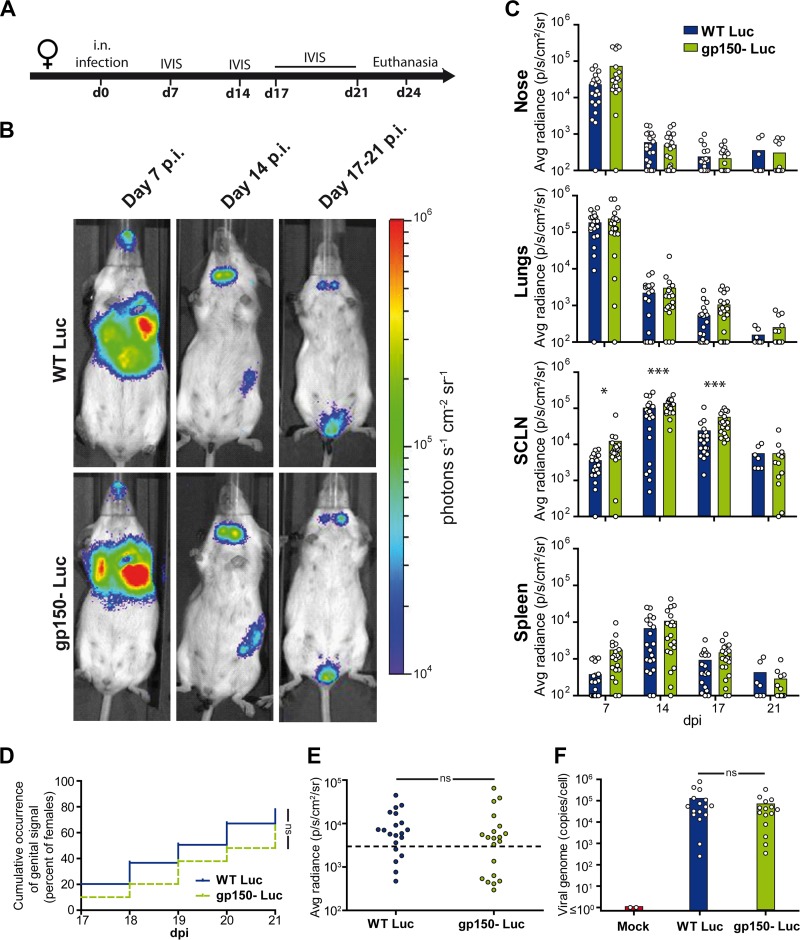
FIG 2.
Bioluminescence imaging of gp150− MuHV-4. (A) Female mice were infected intranasally with gp150+ or gp150− Luc MuHV-4 (104 PFU under general anesthesia) and imaged at the times indicated. (B) Representative images are shown for each group at days 7, 14, and 17 to 21 p.i. (C) Signal intensities were compared for each organ (n = 20 mice per group), measuring equivalent regions of interest and subtracting the right abdominal signal as a negative background. The limit of detection of the assay is 102 photons/s/cm2/sr. Results were analyzed by a linear model, using day postinfection, strain, and interaction between day and strain as factors (P > 0.05 for all comparisons, except for the SCLN, where gp150− signals were significantly higher at days 7, 14, and 17 [*, P < 0.05; ***, P < 0.001]). (D and E) To assay genital tract colonization, mice were imaged every day from days 17 to 21 p.i. Positive signals were taken as those >2 standard deviations above the mean for 10 uninfected mice (threshold represented by the dashed line). The occurrence of a genital signal (D) (n = 40 mice per group) and the maximal genital signal (E) (n = 20 mice per group) showed no significant difference between groups (P > 0.05 by chi-square and Mann-Whitney tests, respectively). (F) The smallest pieces of genital tissue expressing luciferase were isolated. Genome copy numbers were then measured by qPCR and did not show a significant difference between groups (n = 20 mice per group; P > 0.05 by a Mann-Whitney test). The histograms show mean values. The results are representative of data from three independent experiments. ns, not significant.

