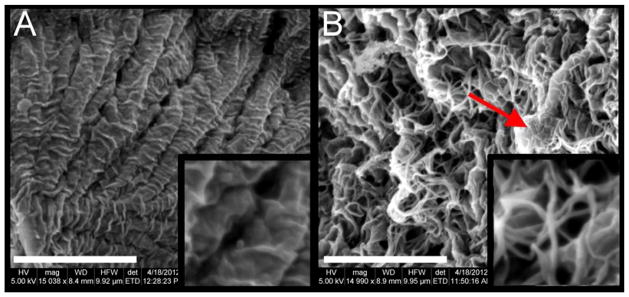
Figure 5.
Microscopy-based assessment of IPN microstructure. (A) A representative SEM image of a nominal 10% w/v 6.0 kDa PEGDA hydrogel control at 15,000X magnification, scale bar = 4 μm. The image inset shows the gel structure at 40,000X magnification; (B) A representative SEM image of a 6.0 kDa PEGDA IPN, 60 min infiltration time at 15,000X magnification, scale bar = 4 μm, arrow indicating a flat PEGDA structure surrounded by collagen fibrils. The image inset shows the gel structure at 40,000X magnification.

