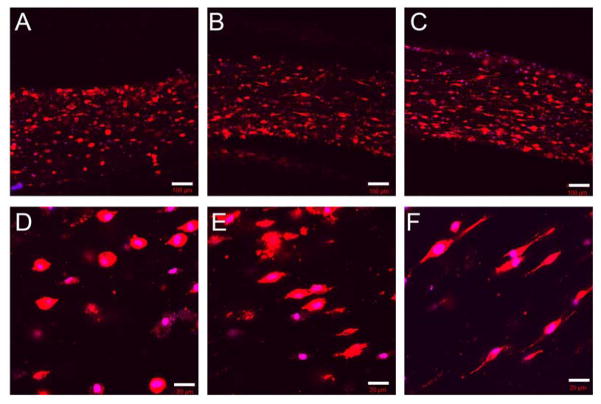
Figure 7.
Representative images of phalloidin-stained cells in collagen-PEGDA IPNs (3 mg/mL collagen, 6.0 kDa PEGDA) as a function of the delay time between collagen network formation and PEGDA infiltration. (A, D) 0 h delay time, (B, E) 4 h delay time, (C, F) 6 h delay time. The cell cytoskeleton is stained with rhodamine phalloidin, and the cell nuclei are stained with DAPI. The scale bars in (A, B, C) equal 20 μm and the scale bars in (D, E, F) equal 100 μm.

