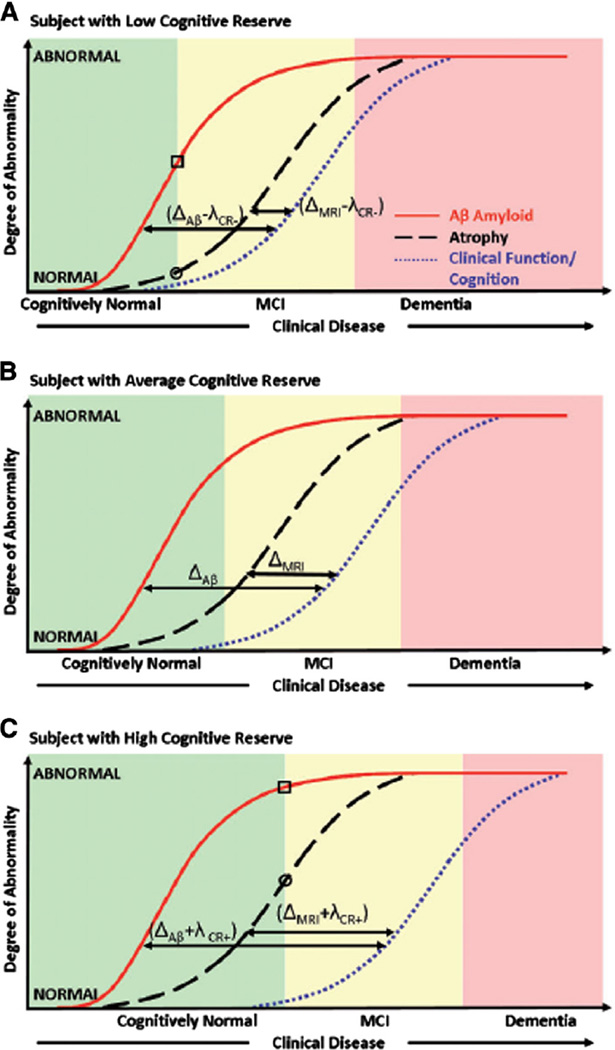
Fig. 28.
Model illustrating the independent effect of cognitive reserve on the relationship between biomarkers of pathology and cognition in subjects with (A) low, (B), average and (C) high cognitive reserve. In (A) and (C), the levels of Aβ are indicated by a square and the levels of atrophy are indicated by a circle at the point where cognitively normal subjects progress to MCI. This illustrates that at an equivalent clinical diagnostic threshold, subjects with high cognitive reserve have greater biomarker abnormalities than those with low cognitive reserve. Reproduced with permission from Ref [278].

