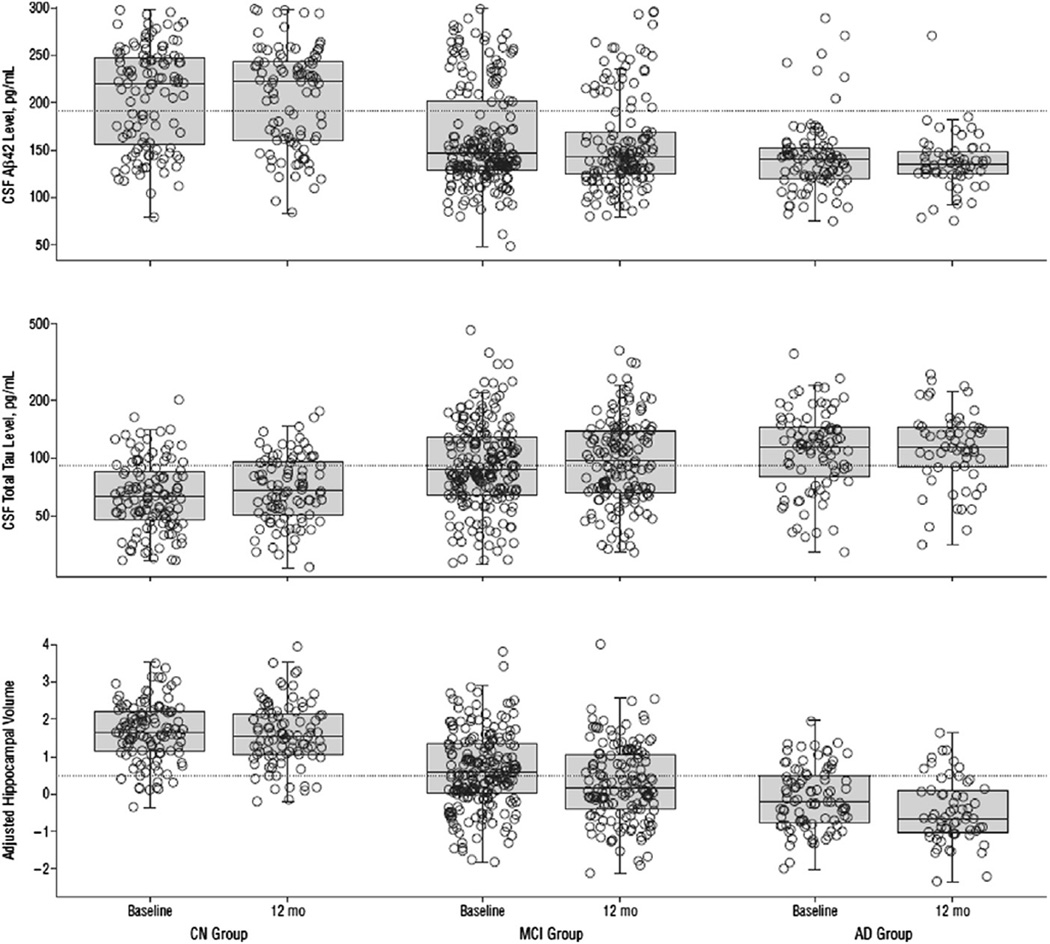
Fig. 29.
Box plots and superimposed data points showing the distribution of AD biomarkers by baseline diagnosis and visit. The dotted horizontal line extending across all box plots represents the cut point delineating normal from abnormal for each biomarker. Reproduced with permission from Ref [282].

