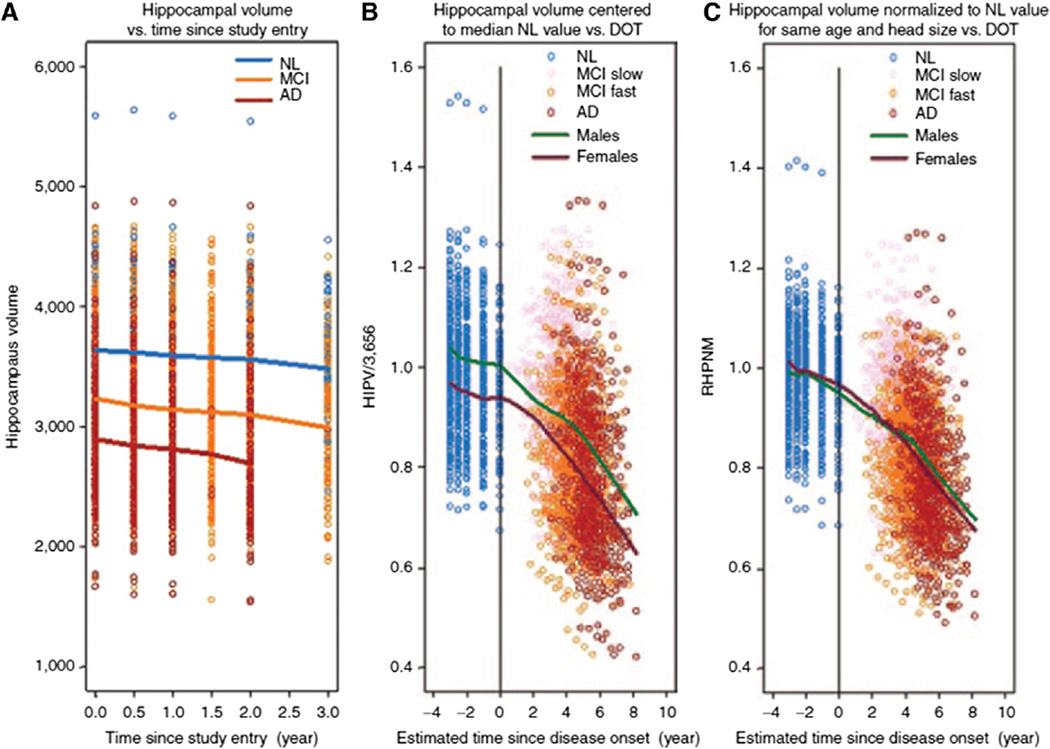
Fig. 42.
The effect of modeling disease onset time on hippocampal volume-time profiles. (A) Evolution of hippocampal volumes for each disease status. Disease onset times are shown with hippocampal volume (B) centered to the median of the normal population and (C) normalized for age and head size. From Delor et al [504]. Abbreviations: MCI, mild cognitive impairment; AD, Alzheimer’s disease.

