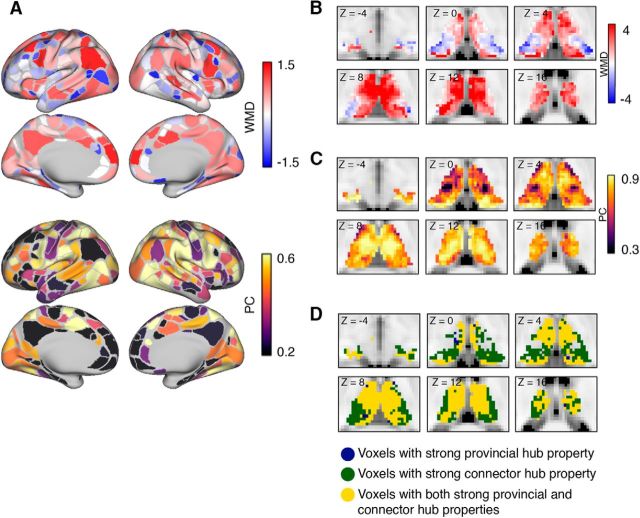
Figure 4.
Spatial distribution of network metrics. A, WMD and PC values of cortical ROIs. B, WMD values of thalamic voxels. C, PC values of thalamic voxels. D, Location of voxels with strong connector (dark navy blue), provincial (dark green), or connector plus provincial hub properties (gold) in the thalamus. In D, only thalamic voxels that exhibited PC and/or WMD values of >90% of all cortical ROIs are displayed. All graph metrics averaged across network densities ranged from 0.01 to 0.15.

