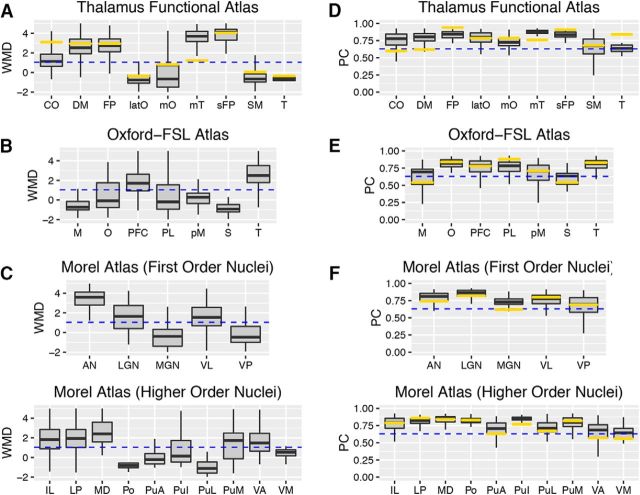
Figure 5.
Graph metrics of each thalamic subdivision. A–F, Box plots summarizing WMD values (A–C) and PC values (D–F) for all thalamic voxels for each thalamic subdivision in each thalamic atlas. The horizontal blue dashed line represents WMD or PC values of cortical provincial or connector hubs (arbitrarily defined as >90% of all cortical ROIs). The horizontal gold bar in each individual box plot represents the graph metrics calculated on the level of thalamic subdivision. Abbreviations for the Oxford-FSL atlas are as follows: M, motor; O, occipital; PFC, prefrontal; PL, parietal; pM, premotor; S, somatosensory; T, temporal. Box plot percentiles (5th and 95th for outer whiskers; 25th and 75th for box edges) calculated across voxels for each thalamic subdivision. All graph metrics were averaged across network densities (see Materials and Methods).

