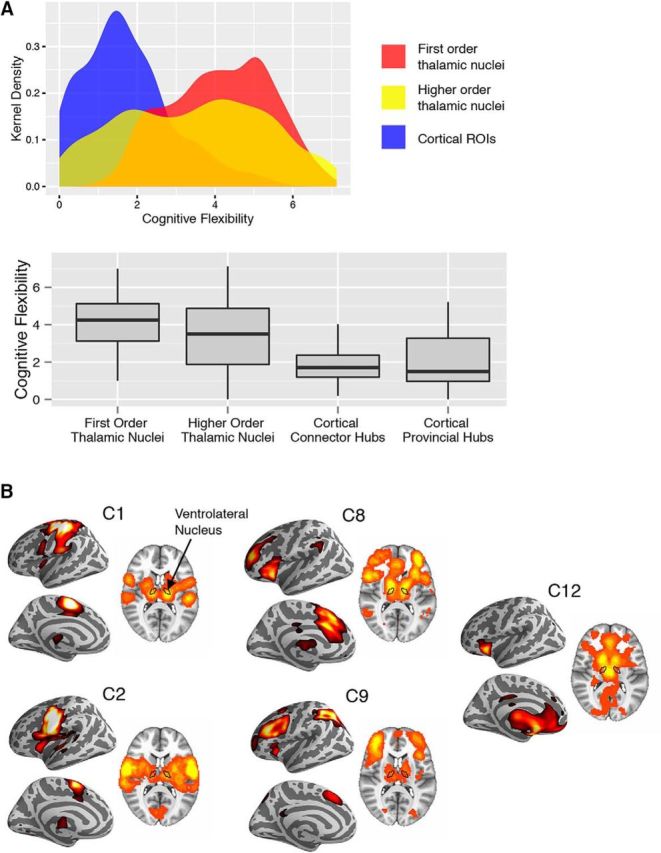
Figure 7.

Cognitive flexibility score and cognitive components. A, Kernel density plot and box plots of cognitive flexibility scores for thalamic voxels and cortical ROIs. Thalamic voxels were categorized into two categories of thalamic nuclei. Box plot percentiles (5th and 95th percentiles for outer whiskers; 25th and 75th for box edges) were calculated across voxels for each type of thalamic nucleus or across cortical ROIs for each type of cortical ROI. B, Spatial distribution of brain activity engaged by each cognitive component recruited by the thalamic nucleus VL.
