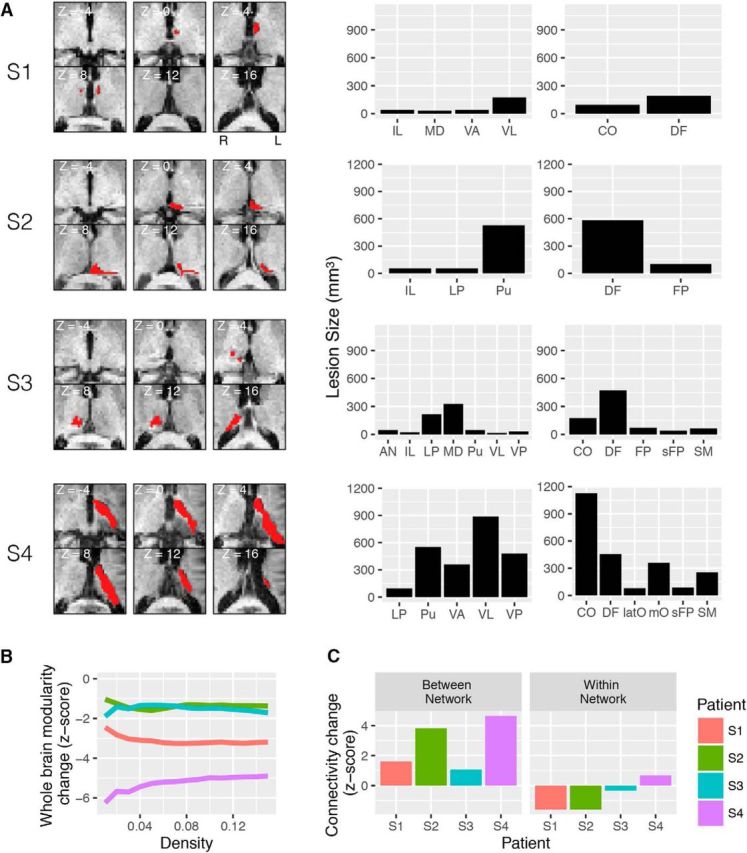
Figure 8.

The effect of a focal thalamic lesion on cortical network organization. A, MRI scans of thalamic lesions (marked in red) in four patients (S1–S4). The lesion size for each patient in each thalamic subdivision (left, based on Morel atlas; right, based on the functional parcellation atlas) is summarized in bar graphs. B, Individual patient's normalized modularity score across network densities (x-axis) for the whole cerebral cortex. C, Individual patient's normalized connectivity strength for between-network and within-network connectivity.
