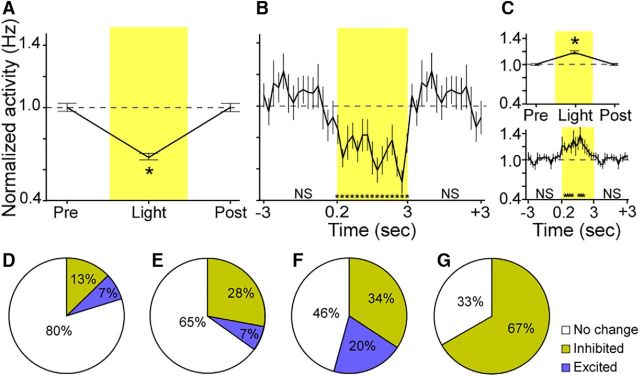
Figure 2.
A, Normalized activity of inhibited cells (n = 12) during the 3 s period before light delivery (Pre-Light), during light delivery (Light), and during the 3 s period after light delivery (Post-Light). Note the data for the Pre-Light and Post-Light periods are identical due to the continuous light on/off delivery cycle (3 s on/off). B, Activity of inhibited cells during the Pre-Light, Light, and Post-Light periods in 200 ms bins. C, Top, Normalized activity of excited cells (n = 7) during the Pre-Light, Light, and Post-Light delivery periods. Bottom, Activity of excited cells during the Pre-Light, Light, and Post-Light periods in 200 ms bins. D, Proportion of inhibited units out of total recorded units. E, Proportion of inhibited units out of total recorded units on tetrodes that ever had an inhibited unit on any recording session. F, Proportion of inhibited units out of total recorded units from tetrodes that had an inhibited or excited unit on that same recording session. G, Proportion of inhibited units out of total recorded units from the tetrodes on which the inhibited unit was recorded during each session. Error bars represent the SEM. *p < 0.05 compared with baseline average. ns, Not significant.

