
Figure 2.
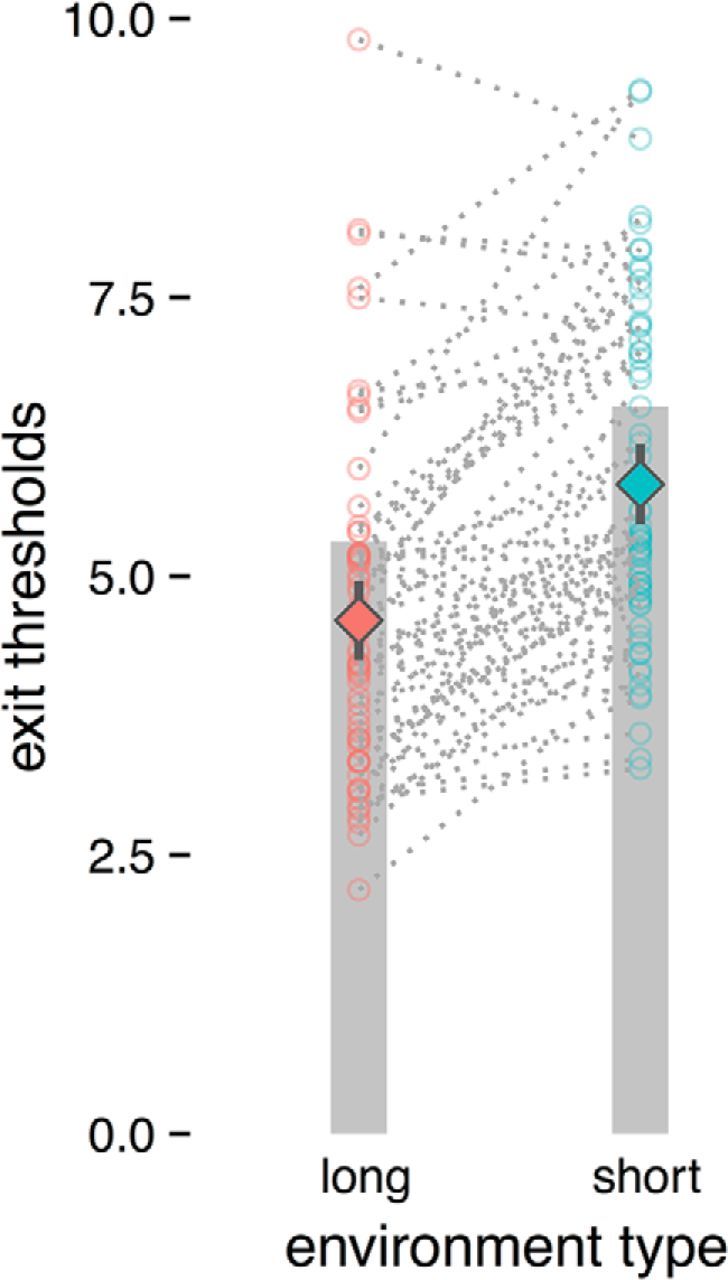
Mean exit thresholds per environment type. Gray bars indicate optimal thresholds for each environment type (long or short) as given by the MVT. Open circles indicate per-subject mean exit thresholds for each environment type. Diamonds indicate mean exit thresholds across all subjects for each environment type, with 95% confidence intervals. Overall, subjects demonstrated sensitivity to changes in the environment quality by adjusting their thresholds adaptively in a manner consistent with the MVT.