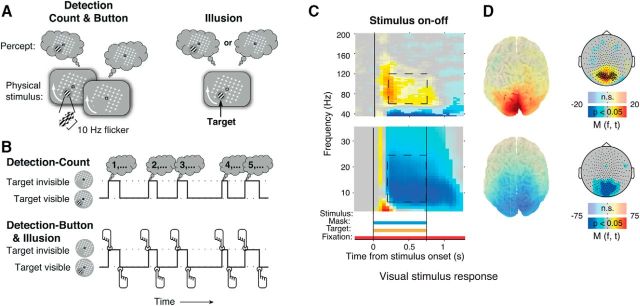
Figure 1.
Stimuli, behavioral tasks, and stimulus response in visual cortex. A, Schematic snapshots of stimuli and alternating percepts. Left, Detection stimulus. A salient, flickering target stimulus (Gabor patch) was surrounded by a moving mask pattern (white), which appeared as a rotating grid. The target was intermittently removed from the display. Top left, The corresponding perception of the target. Right, Corresponding stimulus and alternating perception during the Illusion condition, in which the target did not flicker or physically disappear. Perceptual disappearances (top right) were illusory in this condition. B, Behavioral task conditions. Top, Detection-Count. Subjects counted the disappearances during the 3 min run and reported the total after the end of the run in a 4AFC question. Bottom, Detection-Button and Illusion. Subjects reported target disappearances and reappearances by alternating button presses of two buttons. C, Cortical response to the stimulus during Stimulus-on-off. Fully saturated colors indicate clusters of significant modulation (p < 0.05, two-sided permutation test across subjects, cluster-corrected; N = 23 subjects). D, Source maps and scalp maps, topography of 8–25 and 60–120 Hz modulations (0.25–0.75 s after stimulus onset; see dashed outlines on time–frequency representations). Highlighted circles in high-frequency scalp map (top right): MEG sensors showing the biggest stimulus response. These sensors were used for the subsequent analyses of overall power modulation.

