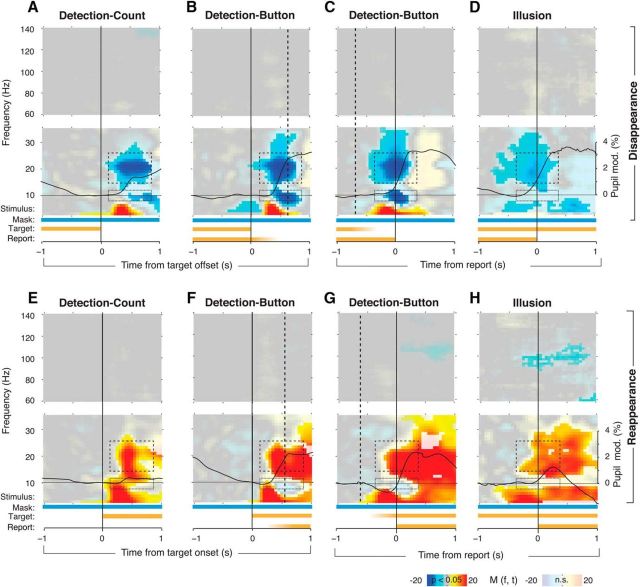
Figure 2.
Perceptual modulation with or without motor act. MEG power modulations are shown as time–frequency representations, averaged across trials within each subject and then across subjects. Fully saturated colors highlight clusters of significant modulation (p < 0.05, two-sided permutation test across subjects, cluster corrected). In each panel, the top and bottom time-frequency representation correspond to the high- and low-frequency ranges, respectively. The bars underneath the time–frequency representations depict the time course of stimulus components and subjects' reports. Fading indicates variable timing of the instantaneous stimulus changes or report with respect to the trigger. Solid black time courses: pupil responses (group average). Dashed boxes indicate alpha power (8–12 Hz) and beta power (15–25 Hz) modulation. Different panels correspond to different experimental conditions and different trigger events. A, Detection-Count, aligned to stimulus offset. B, Detection-Button, aligned to stimulus offset. Dashed line indicates the median reaction time. C, Detection-Button, aligned to disappearance report. Dashed line corresponds to the median time of stimulus offset. D, Illusion, aligned to the disappearance report. E–H, Corresponding modulation aligned to stimulus onset or reappearance report.

