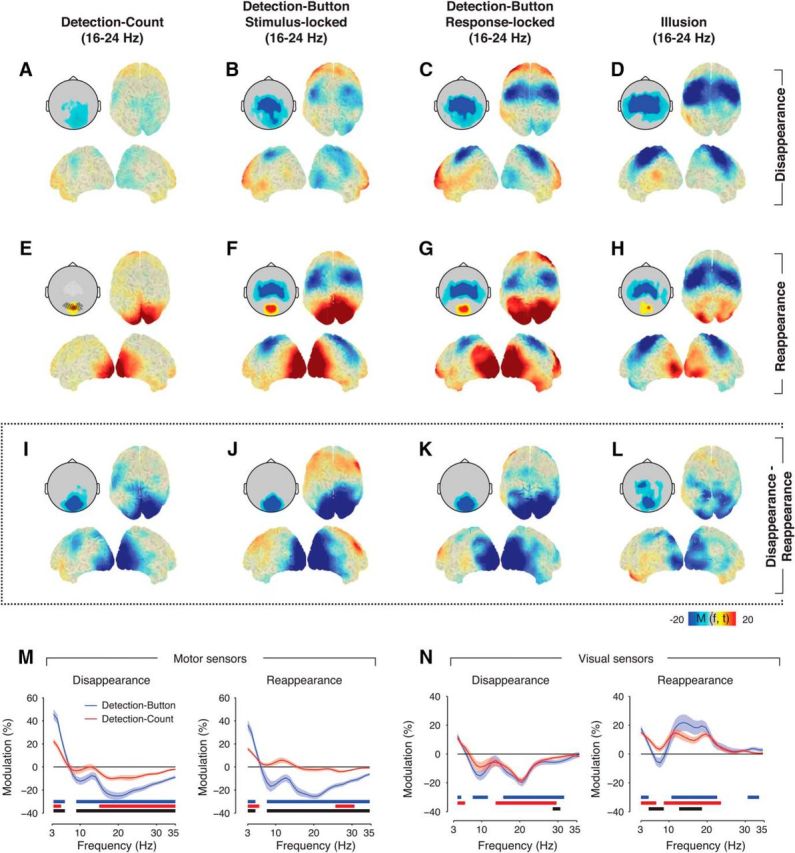
Figure 3.

Dissociation of perceptual and movement-related modulation. Source reconstructions and topographical scalp maps of 16–24 Hz modulations around target disappearance, reappearance, and the difference for all conditions. The highlighted black circles on the scalp map in E indicate occipital sensors that were used for the time–frequency representations in Figure 2 and frequency spectra in N, highlighted white circles indicate motor sensors used in M. A, Detection-Count, disappearance. B, Detection-Button disappearance, locked to stimulus offset. C, Detection-Button disappearance, locked to report of disappearance. D, Illusion disappearance. E–H, Corresponding maps for target reappearance. I–L, Corresponding maps for disappearance − reappearance difference. M, Spectra of the power modulation in sensors overlying motor cortex (white circles in E) of the Detection-Button (blue) and Detection-Count condition (red) in the time window around median response time (0.45–0.75 s from stimulus change), separately for disappearance (left) and reappearance trials (right). Shaded areas correspond to SEM over subjects. Solid bars under the spectra reflect clusters of significant power modulation (p < 0.05, two-sided permutation across subjects, cluster corrected) for Detection-Button (blue), Detection-Count (red), and the difference between Detection-Button and Detection-Count (black). N, Corresponding results for visually responsive sensors as defined in Figure 1D (black circles in E).
