
Figure 1.
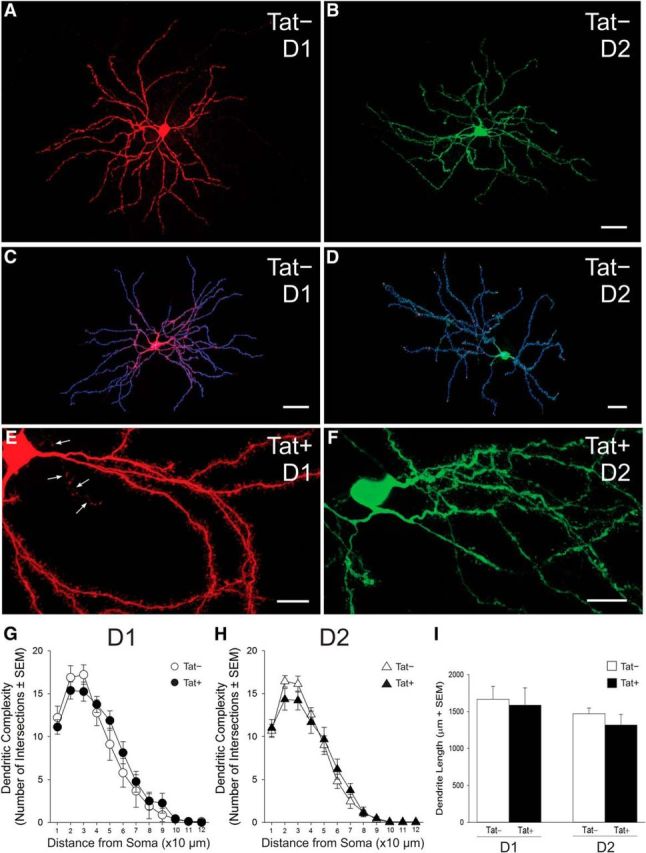
Structure of D1 and D2 receptor-expressing striatal MSNs in Tat− and Tat+ transgenic mice. A–F, D1 (A, C, E) and D2 (B, D, F) MSNs were identified via expression of tdTomato or eGFP, respectively, and filled with biocytin for morphological assessment; a filled axon is shown in E (arrows). C, D, Biocytin-filled neurons were reconstructed in 3D from sequential, Z-stacked, confocal images and their dendritic complexity was analyzed using Bitplane Imaris software (version 7.6.4). G–I, Dendritic complexity (G, H) and overall length (I) as estimated using Scholl analysis did not differ significantly between Tat+ and Tat− transgenic mice in either D1 (G) or D2 (H) MSNs. Scale bars: A, B, 10 μm; C, D, 30 μm; and E, F, 5 μm.