
Figure 2.
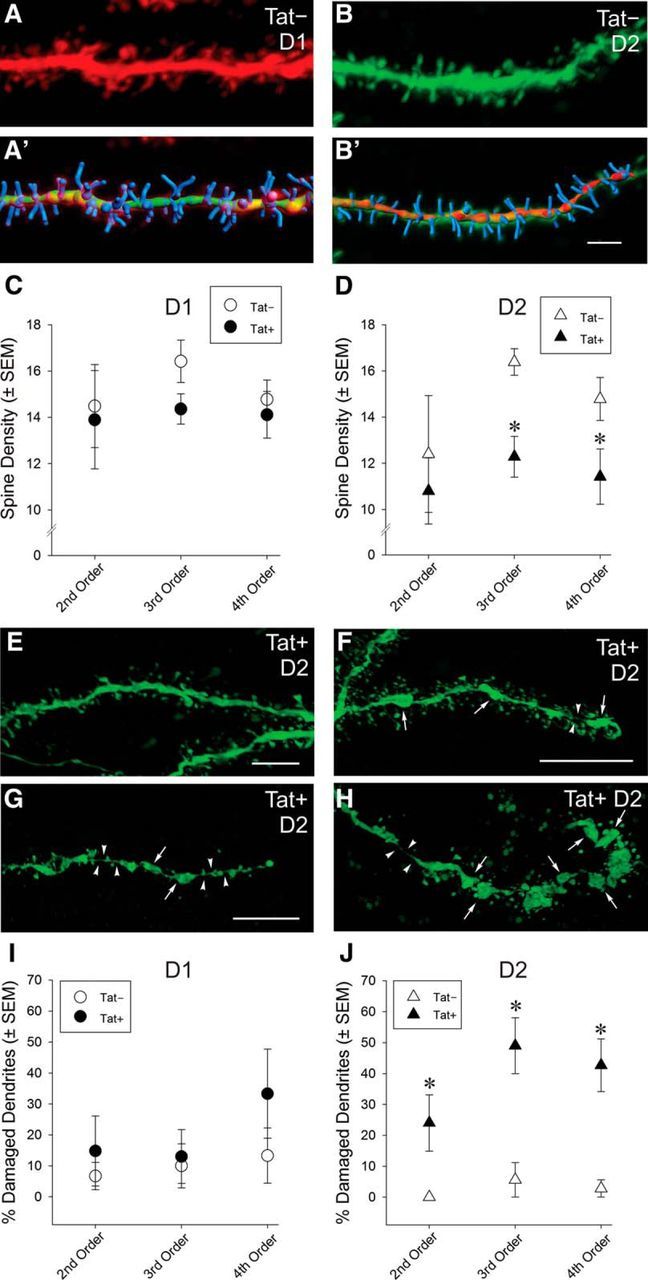
A–J, Synaptodendritic structure of D1 and D2 receptor-expressing striatal MSNs in Tat− and Tat+ transgenic mice. No differences in dendritic spine density were observed in D1 MSNs between Tat+ and Tat− transgenic mice (A, A′, C); however, Tat+ mice had significantly lower dendritic spine density in D2 MSNs compared with Tat− mice (B, B′, D). A′, B′, Superimposed, Bitplane Imaris 3D reconstructions of the same dendrites as in A and B. Scale bar, 3 μm. *Significant main effect of genotype, p < 0.05 (D). E–J, Compared with dendrites of D2 MSNs in Tat− mice (B, I), a significantly greater proportion of dendrites in Tat+ mice displayed swellings/varicosities (arrows) and thinning (arrowheads) of the main axis of the dendrite indicative of dendritic damage and/or pending fragmentation (F–H), although dendrites with normal morphology lacking swelling/varicosities could also be found on D2 MSNs (E). Images in E–H were sharpened (Gaussian blur) and median gray levels adjusted in Adobe Photoshop CS6 to better illustrate subtle boundaries, especially those associated with regions of dendritic thinning. Scale bar, 3 μm (F,H are the same scale). *Significant main effect of genotype, p < 0.05 (J).